TaZ_65
Well-Known Member
- First Name
- Eric
- Joined
- Feb 19, 2021
- Threads
- 7
- Messages
- 93
- Reaction score
- 165
- Location
- Northern Illinois
- Vehicle(s)
- JLUR
- Thread starter
- #1
So, I switched shocks from Falcon 2.1 to Fox 2.5 tuned by @AccuTunedJL. I felt the butt in seat improvement immediately but wanted to prove that it wasn't placebo.
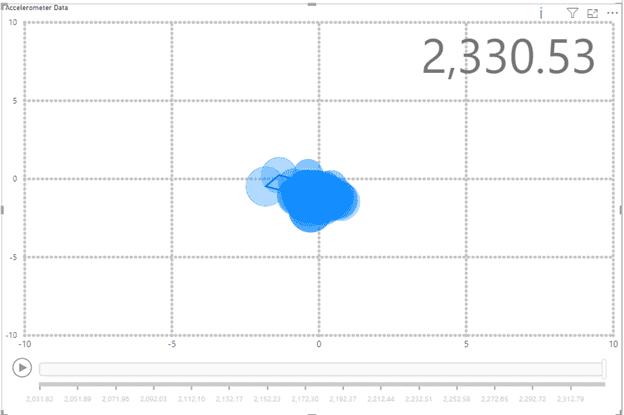
I figured why not download a data log app on my iPhone and compare the morning highway commute. I used the accelerometer X,Y, and Z readings over the course of the commute; I'm not an engineer but it seems reasonable... someone chime in.
My conclusion is that the data shows less bumpiness and a tighter overall deflection (probably the wrong word) profile over the course of the drive. Mostly sharing because I love these new AccuTune shocks, but I would love to hear your feedback on whether this type of analysis is helpful in any way.
Before, with Falcon 2.1:

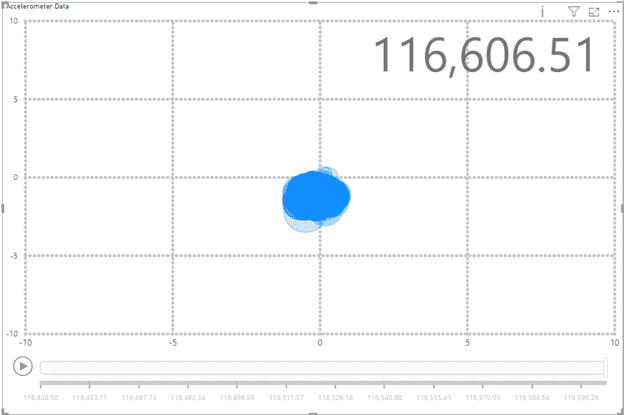
After, with AccuTune Fox 2.5:
I figured why not download a data log app on my iPhone and compare the morning highway commute. I used the accelerometer X,Y, and Z readings over the course of the commute; I'm not an engineer but it seems reasonable... someone chime in.
My conclusion is that the data shows less bumpiness and a tighter overall deflection (probably the wrong word) profile over the course of the drive. Mostly sharing because I love these new AccuTune shocks, but I would love to hear your feedback on whether this type of analysis is helpful in any way.
Before, with Falcon 2.1:
After, with AccuTune Fox 2.5:
Sponsored